Bollinger Bands
Bollinger Bands are a widely used Technical Analysis - 20230221094216 tool that can help traders and investors better understand market trends and volatility. Indeed, the bands are designed to provide a clear picture of price volatility and to help traders identify potential buy and sell signals.
Definition
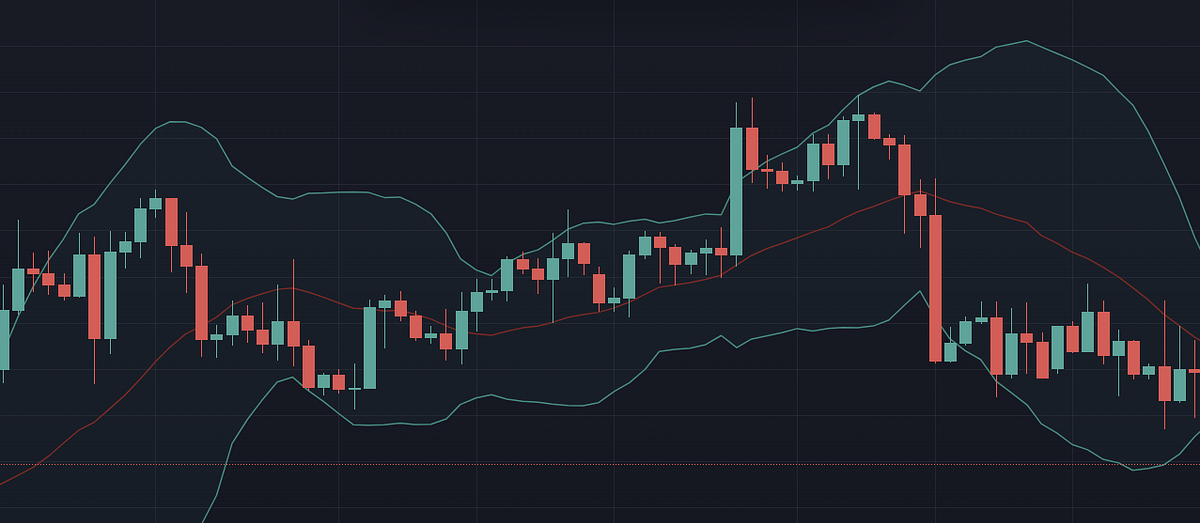
Bollinger Bands are a technical analysis tool that provides an indication of market Volatility and trends.
They consist of three lines that are plotted around a moving average line:
- Moving Average Line: The moving average line is the central component of Bollinger Bands, and is typically calculated as a 20-day simple moving average (SMA) of the underlying asset’s price. This line provides a visual representation of the average price of the asset over the specified time period, and serves as the base for the upper and lower bands.
- Upper Band: The upper band is plotted two standard deviations above the moving average line, and serves as a measure of volatility. When prices move above the upper band, it can indicate that the asset is overbought, and may be due for a price correction. Conversely, when prices move below the upper band, it can indicate that the asset is undervalued, and may be due for a price increase.
- Lower Band: The lower band is plotted two standard deviations below the moving average line, and serves as a measure of volatility. When prices move below the lower band, it can indicate that the asset is oversold, and may be due for a price increase. Conversely, when prices move above the lower band, it can indicate that the asset is overvalued, and may be due for a price correction.

Red: moving average, Green: upper and lower bands
The Bollinger Bands themselves do not generate buy or sell signals, but they can provide you with valuable information about the direction and strength of price trends, as well as help to identify overbought and oversold conditions. The distance between the bands can also provide a useful measure of volatility, with wider bands indicating higher volatility and narrower bands indicating lower volatility.
How to Use Bollinger Bands
Bollinger Bands can be used in a lot of ways. Some of them include:
- Identifying Overbought and Oversold Conditions: Bollinger Bands can be used to identify overbought and oversold conditions in the market, as I said before.
- Spotting Trend Reversals: Bollinger Bands can also be used to identify potential trend reversals. When prices move from the upper band to the lower band, it can indicate a potential trend reversal from an uptrend to a downtrend, and vice versa.
- Measuring Volatility: The distance between the bands can provide a useful measure of volatility, with wider bands indicating higher volatility and narrower bands indicating lower volatility. Traders can use this information to adjust their trading strategies accordingly, for example, taking a more cautious approach during periods of high volatility.
- Confirming Breakouts: Bollinger Bands can also be used to confirm breakouts. When prices break out above the upper band, it can indicate the start of a new uptrend, while a break below the lower band can indicate the start of a new downtrend.
Bollinger Bands Strategies
There are some well-known “academic” strategies using Bollinger Bands. By “academic” I mean they are just examples and may work or may not work, you should not rely fully on them but try to develop your own strategies using them.
- Mean Reversion: The mean reversion strategy is based on the idea that prices tend to revert back to the average over time. Under this strategy, traders will look for price action that has moved outside of the upper or lower band and enter trades in the expectation that prices will revert back to the average.
- Breakout Trading: The breakout strategy involves waiting for prices to break out of the Bollinger Bands, and then entering trades in the direction of the breakout. For example, if prices break above the upper band, traders may enter a long position, while if prices break below the lower band, traders may enter a short position.
- Trend Following: The trend following strategy involves using Bollinger Bands to identify trends and then entering trades in the direction of the trend. For example, if prices are consistently trending above the upper band, traders may enter a long position, while if prices are consistently trending below the lower band, traders may enter a short position.
- Bollinger Band Squeeze: The Bollinger Band squeeze strategy involves looking for periods of low volatility, as indicated by narrow Bollinger Bands, and then entering trades in the direction of the subsequent breakout.
Limitations of the Bollinger Bands
As with any indicator, you have some things to keep in mind and be aware of when using Bollinger Bands:
Lagging Indicator/Data Dependence: Bollinger Bands are based on past price data, and do not provide information about future market movements. This data dependence means that Bollinger Bands can be subject to hindsight bias, and can sometimes provide false signals.
Limited Predictive Ability: As a consequence of the above, Bollinger Bands are not designed to predict future market movements and can only provide information about past market trends and volatility. This limited predictive ability means that Bollinger Bands should not be used as a standalone indicator, and should be used in conjunction with other technical analysis tools and fundamental analysis to provide a comprehensive view of market conditions.
Not Suitable for all Markets: Bollinger Bands may not be suitable for all markets, and may not provide accurate signals in markets with low volatility or irregular price movements.
META
Status:: #wiki/notes/mature
Plantations:: Technical Indicators - 20230221104502
References:: Babypips