Commitment of Traders Report
The Commitment of Traders (COT) report is a weekly publication by the Commodity Futures Trading Commission (CFTC) that provides valuable insight into the positions of various market participants in futures markets. The report shows the positions held by commercial traders, non-commercial traders, and non-reportable traders in a given futures market.
Commercial traders are typically hedgers who use futures contracts to protect themselves against price fluctuations in the physical commodity, while non-commercial traders are speculators who enter into futures contracts to profit from price movements. The non-reportable traders are usually small speculators who hold positions below the reporting threshold.
The COT report provides information on the net positions held by each group of traders, as well as changes in those positions from the previous week. This information can be useful for traders and analysts to gauge market sentiment and potential price movements.
The COT report is widely followed by participants in the futures markets, including traders, analysts, and institutional investors. It is available to the public on the CFTC website every Friday at 3:30 p.m. Eastern Time.
One way to use the COT report in your trading is to find extreme net long or net short positions.
Signals
As the value of the net short positions of non-commercial traders (the green line) dropped, so did EUR/USD
While hedgers buy when the market is bottoming, speculators sell as the price moves down.
As a result, speculative positioning indicates trend direction while commercial positioning could signal reversals.
The basic rule is this: every market top or bottom is accompanied by a sentiment extreme, but not every sentiment extreme results in a market top or bottom.
How to Use it
This link: https://www.cftc.gov/MarketReports/CommitmentsofTraders/index.htm
Then: Once the page has loaded, scroll down a couple of pages to the “Current Legacy Report” and click on “Short Format” under “Futures Only” on the “Chicago Mercantile Exchange” row to access the most recent COT report.
It may seem a little intimidating at first because it looks like a big giant gobbled-up block of text but with a little bit of effort, you can find exactly what you’re looking for.
Just press CTRL+F (or whatever the find function is of your browser) and type in the currency you want to find.
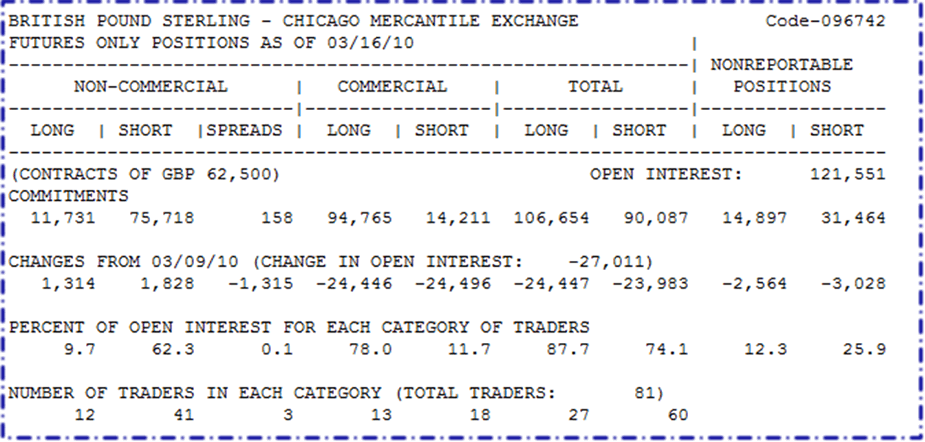
To find the British Pound Sterling or GBP, for example, just search up “Pound Sterling” and you’ll be taken directly to a section that looks something like this:

Hedgers
A key characteristic of hedgers is that they are most bullish at market bottoms and most bearish at market tops.
Large Speculators
Many speculators are known as hardcore trend followers since they buy when the market is on an uptrend and sell when the market is on a downtrend.
Small Speculators
They are known to be anti-trend and are usually on the wrong side of the market. Because of that, they are typically less successful than hedgers and commercial traders.
How to Create an Index That Measures Market Extremes
Below is a step-by-step process on how to create this index.
- Decide how long of a period we want to cover. The more values we input into the index, the less sentiment extreme signals we will receive, but the more reliable it will be. Having fewer input values will result in more signals, although it might lead to more false positives.
- Calculate the difference between the positions of large speculators and commercial traders for each week.
Difference = Net position of Large Speculators – Net position of Commercials
META
Status:: #wiki/notes/mature
Plantations:: Fundamental Analysis
References:: Babypips