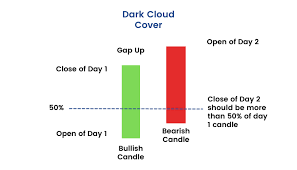
Dark Cloud Cover
In Technical Analysis - 20230221094216 of financial markets, a dark cloud cover is a bearish Candlestick Pattern - 20230221094146 that can indicate a potential reversal in price trend. The pattern occurs when a long white or green candle is followed by a long black or red candle that opens above the previous day's high and closes below the midpoint of the first candle's real body.
The pattern is called a dark cloud cover because the black or red candle "covers" or overshadows the previous day's white or green candle, suggesting a shift in market sentiment from bullish to bearish. The pattern is often seen as a warning sign for traders who are long on a stock or other asset, as it suggests that the uptrend may be losing momentum and that the bears may be taking control.

META
Status:: #wiki/notes/mature
Plantations:: Candlestick Patterns
References:: Naked Forex