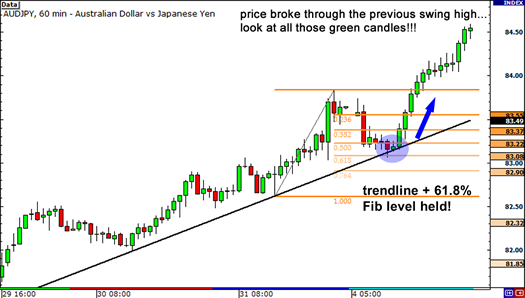
Fibonacci Retracements
It's a Technical Analysis - 20230221094216 tool using Retracements and Extensions.
It works best when the market is trending.
Signals
The idea is to go long (or buy) on a retracement at a Fibonacci support level when the market is trending UP.
And to go short (or sell) on a retracement at a Fibonacci resistance level when the market is trending DOWN.
Use
In order to find these Fibonacci retracement levels, you have to find the recent significant Swing Highs and Swing Lows.
Then, for downtrends, click on the Swing High and drag the cursor to the most recent Swing Low.
For uptrends, do the opposite. Click on the Swing Low and drag the cursor to the most recent Swing High.
They're usable with Supports and Resistances because they can be validated thanks to Fibonacci Retracements.
They're also usable with Trend Lines.

We can also use them with Candlestick Patterns to detect exhausting or strong trends.
Take Profit
Fibonacci Retracements can be used to take profit. Usually, we take profit at significant extension levels.
Stop Loss
Stop loss can be placed at various positions:
- Previous Fibonacci level.
- Previous Swing High or Swing Low.
META
Status:: #wiki/notes/mature
Plantations:: Technical Indicators
References:: Babypips